AI Visibility Report: What It Should Include, With a Free Template
Where to find reports on brand visibility in AI answer engines, and what your own AI visibility report should show, with a section-by-section template you can copy.
Where can you find reports on brand visibility in AI answer engines?
TL;DR: Industry-wide reports come from research published by AI visibility vendors and SEO platforms, such as Yozigo’s study of 248,000 citations and Ahrefs’ Brand Radar index of 470 million prompts. A report on your own brand needs your own tracked questions: visibility, position, sentiment, sources and competitors, measured on the same questions every week.
Key takeaways
- Industry reports show patterns; only your own tracking shows where you stand.
- A useful report separates branded and unbranded questions, because branded ones are named 77–97% of the time.
- Every report should list the sources AI cited, because those are where you act.
- Report trends over weeks, not single answers.
Which AI search visibility benchmark reports are worth reading?
Start with studies that state their sample and date range. Our study of 18,007 AI answers found 77% of 248,000 citations came from third-party sites and 3% from the brand’s own site. Our engine comparison shows how sources, answer length and brands named differ across six engines.
Tool vendors publish benchmarks too
Ahrefs, Semrush and Profound all publish AI visibility research. Ahrefs’ Brand Radar models AI visibility for any brand across a 470-million-prompt index, which is useful for sizing a market before you track it. The Princeton GEO study (Aggarwal et al., ACM KDD 2024) remains the best evidence on which content changes lift visibility.
Treat vendor reports, ours included, as evidence about patterns rather than about your brand. The only report that answers “does AI recommend us?” is one built on your own questions.
What should an AI visibility report include?
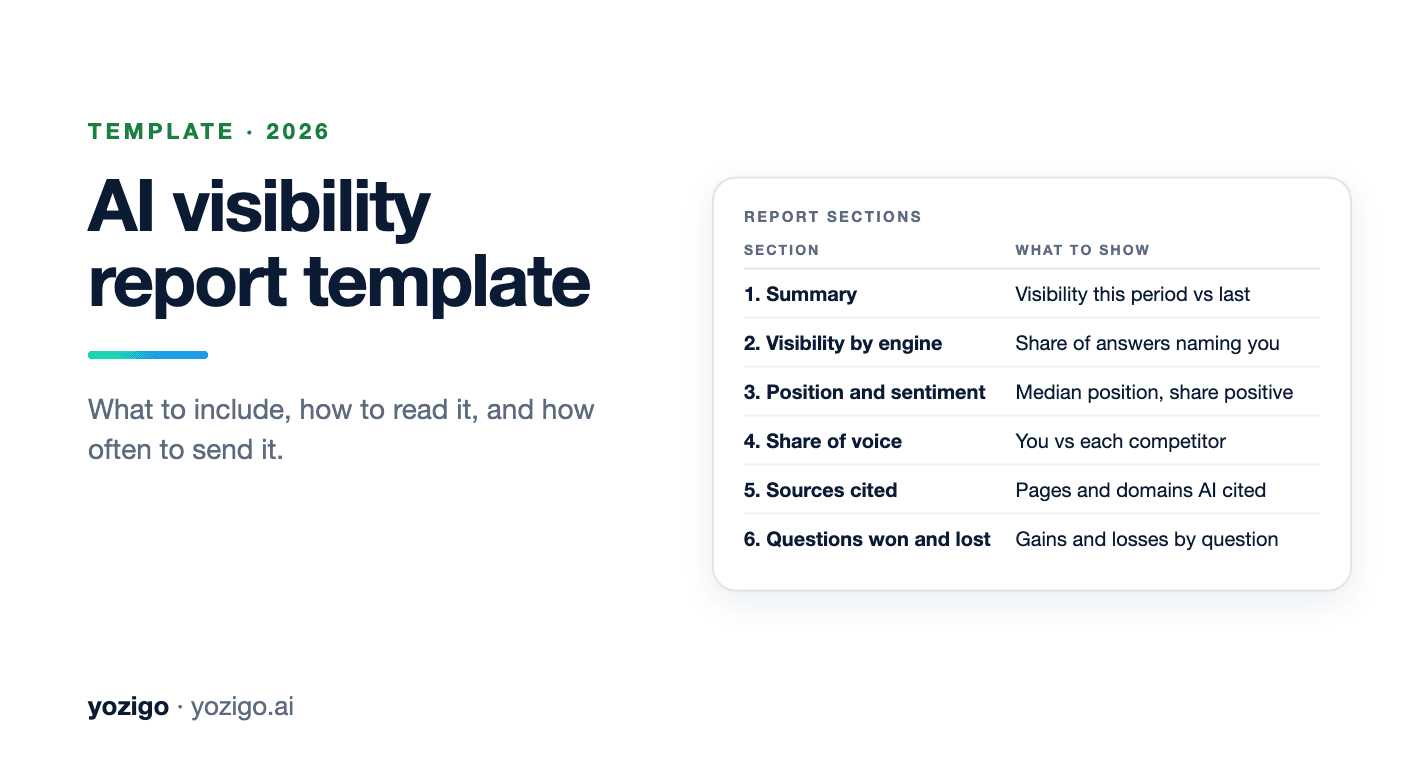
| Section | What to show | Why it matters |
|---|---|---|
| 1. Summary | Visibility this period vs last, best and worst questions, one recommended action | Executives read only this |
| 2. Visibility by engine | Share of answers naming you on each engine, branded and unbranded split | Engines behave differently; branded questions inflate scores |
| 3. Position and sentiment | Median position when named; share of positive, neutral and negative mentions | Being named last or negatively is a different problem from not being named |
| 4. Share of voice | Your mentions vs each tracked competitor, same questions | Shows who is winning the category |
| 5. Sources cited | Top pages and domains AI cited, and which mention you | This is where you act: pages to fix or get listed on |
| 6. Questions won and lost | Questions where you gained or lost a mention, with the source that changed | Links outcomes to work done |
| 7. Actions and results | Work shipped this period and the questions it targeted | Proves cause and effect over time |
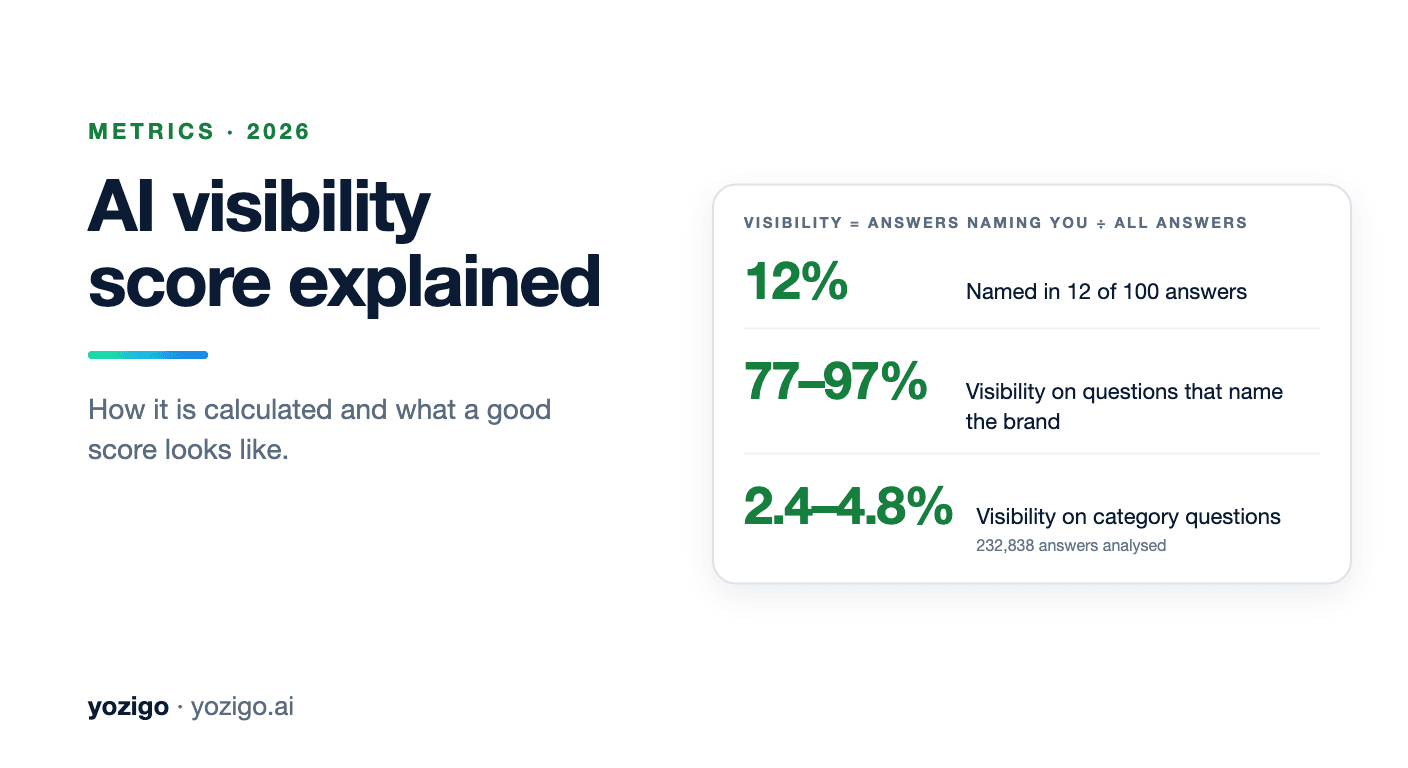
A useful AI visibility report has seven sections, from a one-line summary to the actions taken and their results. The most important split is branded versus unbranded: in 232,838 answers we analysed, brands were named in 77–97% of branded questions but 2.4–4.8% of category questions (Yozigo research, 2026).
Keep the question set fixed between reports. Adding or removing questions changes the score even if nothing else changed. If you must change it, report both the old and new sets for one period.
How should you read the numbers in an AI visibility report?
Split branded from unbranded first. In 232,838 answers we analysed, brands were named in 77–97% of questions that contained their name, but only 2.4–4.8% of category questions. A blended score hides the real picture, as our branded vs unbranded study shows.
Then read trends, not single values. AI answers vary between sessions, so use weekly averages and compare like with like. Our guide to the AI visibility score shows how each number is calculated. Metric definitions are on our methodology page.
Read every number against its base
the questions asked, the engines and the dates. A 7% visibility score on 700 unbranded answers is a different result from 7% on 50 answers, and our confidence rule marks anything under 5 responses as low confidence (methodology).
How often should you send an AI visibility report?
Weekly for the working team and monthly for leadership is the rhythm we recommend. AI answers change daily: in our tracking ChatGPT named about 14 brands per answer and the list shifted between days (Yozigo tracking, October 2026), so weekly averages are the smallest unit worth reporting.
Weekly for the team doing the work, monthly for leadership and clients. Weekly reports catch a lost mention while it is still easy to fix; monthly reports show whether the trend is moving.
Agencies should send each client the same sections in the same order every month, so changes are easy to see. Yozigo builds client-ready reports from the tracked data; see AI visibility tools for agencies for how other tools handle reporting.
Which tools generate AI visibility reports?
Reporting depth varies more than tracking. Of the tools we compared, Yozigo, Peec AI (via Looker Studio on Advanced), LLM Pulse (white-label on Enterprise) and Depra AI (logo reports on higher plans) offer client-facing reports, according to vendor pages checked in October 2026.
Most AI visibility trackers export data; fewer produce a report a client can read. Yozigo builds client-ready reports with before and after scores from the tracked questions. Peec AI connects to Looker Studio on its Advanced plan. LLM Pulse offers white-label reports on Enterprise, and Depra AI adds your logo to reports on its higher plans.
Free one-time checks, such as HubSpot’s AI Search Grader, give a single score from the engines’ training data. They are useful for a first conversation but cannot show a trend. Compare reporting features in our 12 best AI visibility tools guide.
What are the most common AI visibility reporting mistakes?
The most common mistake is reporting a blended score. Branded questions are named 77–97% of the time and lift the average, so a report can look healthy while the brand is missing from almost every category question.
Changing the question set
New questions move the score even if nothing improved. Keep the set fixed, or report old and new sets side by side for one period.
Reporting single answers
AI answers vary between sessions. Use weekly averages and show the range.
Leaving out sources
Without the cited pages, a report says what happened but not what to do next.
Skipping the business link
AI search traffic is still small for most sites but converts well; ChatGPT referral traffic converted at 15.9% against 1.76% for Google organic in one analysis (Seer Interactive, 2025). Report AI-referred visits next to visibility where you can track them, as covered in measuring AI search ROI.
Frequently asked questions: AI visibility reports
A regular summary of how AI engines like ChatGPT, Gemini, Perplexity and Google AI Overviews mention your brand: visibility, position, sentiment, share of voice and the sources they cite, compared over time.
From an AI visibility tool that tracks your questions daily, or by hand with a spreadsheet for a few questions. Free one-time checks like HubSpot’s AI Search Grader give a snapshot, not a trend.
It depends on the category. For unbranded questions, brands in our data were named in 2.4–4.8% of answers on average, so beating your competitors’ share matters more than any absolute number.
Yes. The sources AI cites tell you which pages to fix and where to get mentioned, which makes them the most actionable part of the report.